
What a government Ford F-550 sells for
Retired government Ford F-550 vehicles closed at a middle price of $10,200 over the past year. The middle half of sales landed between $7,175 and $14,200, and the full range ran from $420 to $115,000. Closed sales only, from GSA Fleet and GovDeals.
- Closed sales
- 224
- Middle price
- $10,200
- Middle half
- $7,175–$14,200
- For sale now
- 8+
The price tag
The bar runs from the lowest to the highest sale, the block shows where the middle half landed, and the dot is the middle price. Model-year cards share the same scale, so you can compare them.
Ford F-550 for sale right now
Current prices as of when we last checked each auction. Open one for every fact we have and the link to bid.
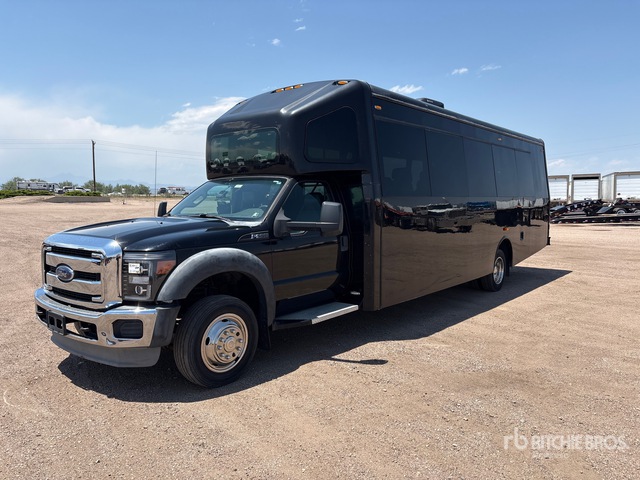 Ritchie Bros.
2013 Ford F-550 4x2 27-Seat Transit Bus
See price
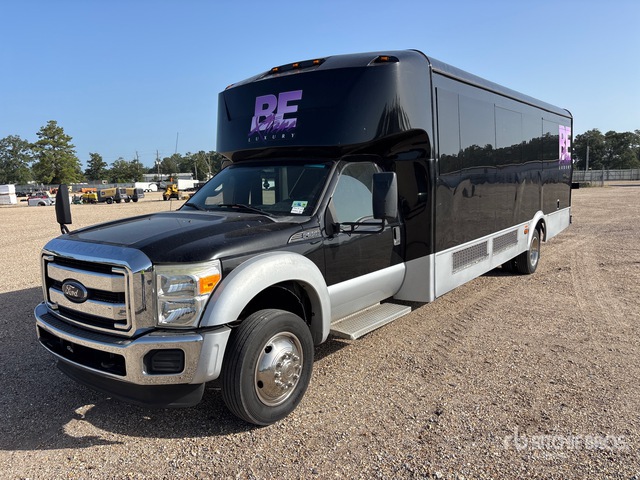 Ritchie Bros.
2012 Ford F-550 4x2 26-Seat Bus
$100
 Proxibid
2011 Ford F-550 Super Duty Service Crane Truck
$120
 Proxibid
2005 Ford F-550 XL Super Duty Diesel Dump Truck with Plow
$1,100
 Proxibid
2012 Ford F-550 Wood Chip Truck
$2,300
 Proxibid
2008 Ford F-550 XL Super Duty Gas Service Crane Truck
See price
 Proxibid
2011 Ford F-550 XL Super Duty Diesel Dump Truck
$325
 Proxibid
2014 Ford F-550 XL Super Duty Diesel Dump Truck with Plow
See price
By model year
The middle price of each model year with at least three closed sales.
Just sold
 $5,000
2012 Ford F-550 ELECTRICIAN SERVICE TRUCK
 $8,600
2000 Ford F-550 RUNS AND DRIVES - SHIPPING AVAILABLE
 $8,300
2014 Ford F-550 SuperCab DRW 2WD W/WACHS vac unit and valve turner
 $15,700
2017 Ford F-550
 $9,850
2011 Ford F-550
 $3,500
2007 Ford F-550
 $12,200
2013 Ford F-550 Crew Cab DRW 2WD
 $29,300
2020 Ford F-550 4x4 Diesel Dump Truck (43,000 Miles)
The full price report · Search every closed sale in the workspace
Month by month
The middle price of closed Ford F-550 sales in each month. Hover a bar for the numbers.
See the monthly numbers
| Month | Sales | Middle price | Middle half sold for | Lowest – highest |
|---|---|---|---|---|
| Feb 26 | 4 | $13,500 | $13,078 – $17,025 | $12,412 – $27,000 |
| Mar 26 | 2 | $21,150 | $14,225 – $28,075 | $7,300 – $35,000 |
| Apr 26 | 10 | $10,100 | $10,000 – $10,575 | $7,100 – $23,900 |
| May 26 | 31 | $10,000 | $9,125 – $11,025 | $2,150 – $86,000 |
| Jun 26 | 10 | $10,450 | $10,025 – $10,775 | $8,200 – $14,200 |
| Jul 26 | 6 | $8,800 | $8,225 – $10,519 | $2,525 – $14,500 |
| Aug 26 | 35 | $10,800 | $7,950 – $20,050 | $850 – $115,000 |
| Sep 26 | 60 | $10,050 | $6,315 – $18,325 | $420 – $67,000 |
| Oct 26 | 66 | $10,150 | $5,738 – $13,188 | $2,691 – $29,300 |
Top states
Where the most Ford F-550 sales happened, with each state's middle price.
Every model year
| Model year | Sales | Middle price | Middle half sold for | Lowest – highest |
|---|---|---|---|---|
| 2020 | 9 | $14,200 | $12,200 – $25,200 | $11,100 – $29,300 |
| 2019 | 24 | $11,700 | $9,675 – $15,825 | $1,860 – $115,000 |
| 2018 | 4 | $22,928 | $8,641 – $49,400 | $8,600 – $86,000 |
| 2017 | 53 | $10,200 | $9,300 – $11,600 | $5,150 – $32,000 |
| 2016 | 19 | $11,200 | $8,500 – $18,250 | $3,100 – $100,000 |
| 2015 | 16 | $14,101 | $10,001 – $18,950 | $7,000 – $35,000 |
| 2014 | 12 | $10,800 | $7,900 – $13,388 | $5,650 – $24,250 |
| 2013 | 5 | $15,600 | $12,200 – $18,700 | $11,025 – $63,000 |
| 2012 | 15 | $8,150 | $5,500 – $12,950 | $420 – $67,000 |
| 2011 | 5 | $9,850 | $7,200 – $21,000 | $4,450 – $21,300 |
| 2009 | 5 | $10,000 | $4,300 – $12,165 | $2,525 – $18,500 |
| 2008 | 14 | $4,475 | $1,333 – $13,500 | $850 – $60,000 |
| 2007 | 7 | $5,550 | $4,525 – $10,350 | $2,425 – $16,950 |
| 2006 | 3 | $13,200 | $8,600 – $13,250 | $4,000 – $13,300 |
| 2005 | 3 | $4,690 | $4,095 – $12,770 | $3,500 – $20,850 |
| 2004 | 5 | $4,451 | $4,351 – $5,815 | $4,162 – $6,403 |
| 2003 | 5 | $5,650 | $4,300 – $6,050 | $3,240 – $6,560 |
| 2002 | 5 | $7,600 | $7,459 – $8,100 | $6,526 – $9,100 |
| 2000 | 4 | $9,050 | $6,826 – $11,500 | $1,502 – $17,500 |
How this report is made
Every number on this page comes from closed government auction sales in the UX Auctions sold archive: 60,822 sales from GSA Fleet and GovDeals that closed between October 24, 2025 and October 24, 2026. Each price is the winning bid the platform published, before buyer's premium, taxes and fees. The archive adds new closed sales every 15 minutes and keeps them, so the report grows every day. Live auction counts and current prices come from the UX Auctions live listings index.
The middle price (median) is the price half the sales were above and half below. The middle half shows where the central 50% of sales landed. Types and models are read from each listing's title, so a few sales may land in the wrong group.
To cite: "UX Auctions Price Report, uxsearch.app/research/prices", with the date you read it. Reporters can reach us at press@uxmail.app.